Overview
Innotech ATOM is a comprehensive Data Acquisition, Billing and Optimisation Management Tool. ATOM enables you to analyse historic data,
generate reports and billing information while helping you to analyse and monitor the performance of your building and environmental impact. ATOM can be
integrated into any new or existing buildings using your current infrastructure. ATOM can be configured to acquire data from supported SQL Server databases,
and generate billing and reporting information using a Tenant/Services database that can be customised to suit your application. ATOM can be enabled as
either a standalone solution or as a multiuser web based solution with support for up to 5 concurrent users via Innotech eServer.
Features
- Dynamic Graphical User Interface
- Real time monitoring of system data
- Comprehensive data analysis suite with forecasting
capabilities
- Set Monthly Targets for each Tenant/Service
- Set tariffs, administration costs, tax rates and specific Tenant/
Service data
- Coloured indication when forecasts exceed the set targets
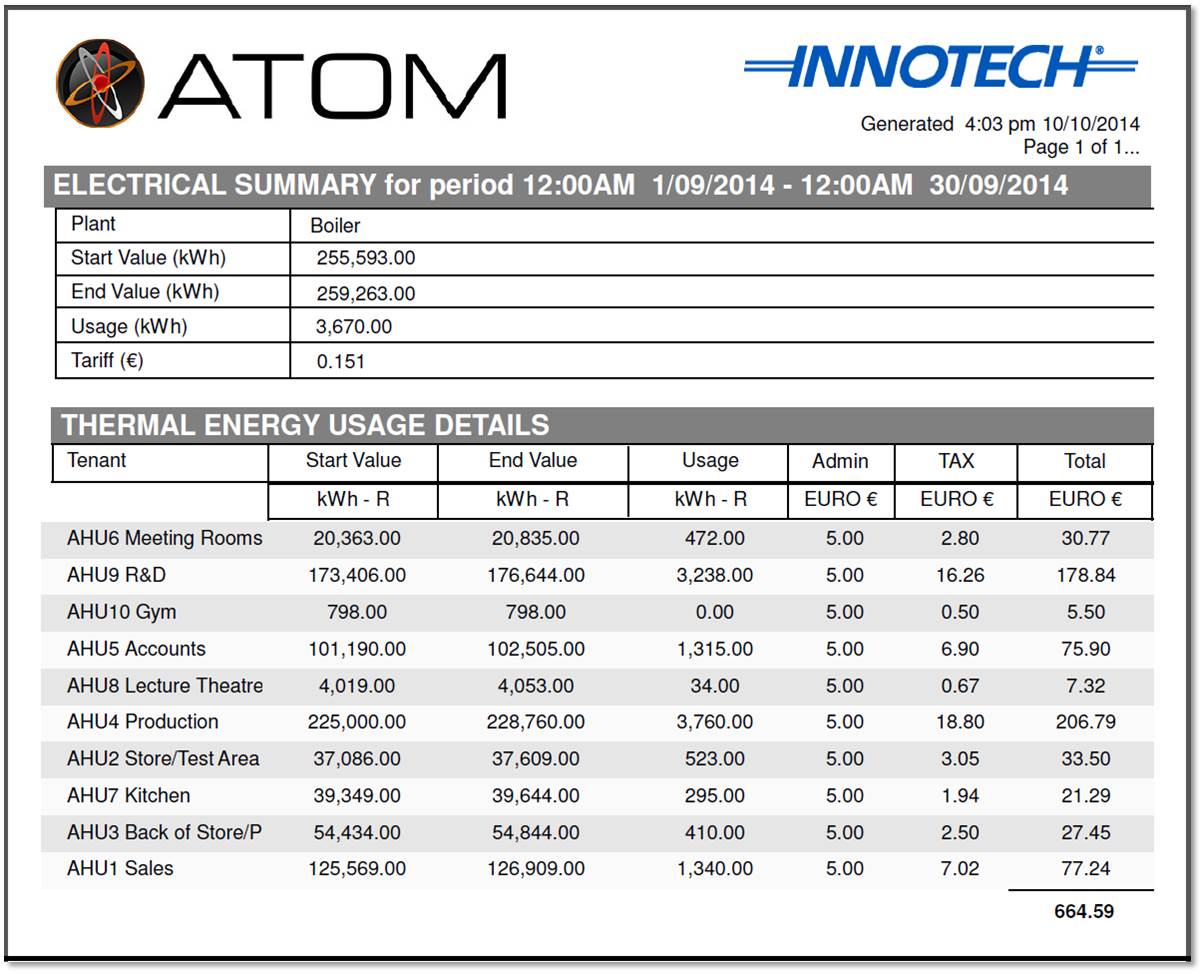
- Full Reporting and Billing capabilities. Generate report and
billing data with relevant and timely information
- Password control with ability to set multiple-level user access
- Seamless integration with Innotech products and devices
- Integrated support for various Building Services protocols
including: BACnet MSTP, BACnet/IP, OPC, Modbus RTU and
Modbus TCP
- Relational database support for Microsoft SQL Server 2008
R2 Express Edition database
- Connect to a local or remotely accessible SQL Server database
- Available as a single computer solution, or as a multiuser
web-based solution with support for 5 concurrent
connections over a network or internet connection
Applications
- Report on various building services: Electrical, Water, Gas, Hours
Run for HVAC Equipment, Energy and Carbon Emissions (CO2-e)
- Generate reports and bill Tenants for various building services:
between specific times and dates, including usage reports and
activity statements for hours run
- Monitor all Primary Meters, and analyse your complete
Environmental Impact and Totalisation of Resources
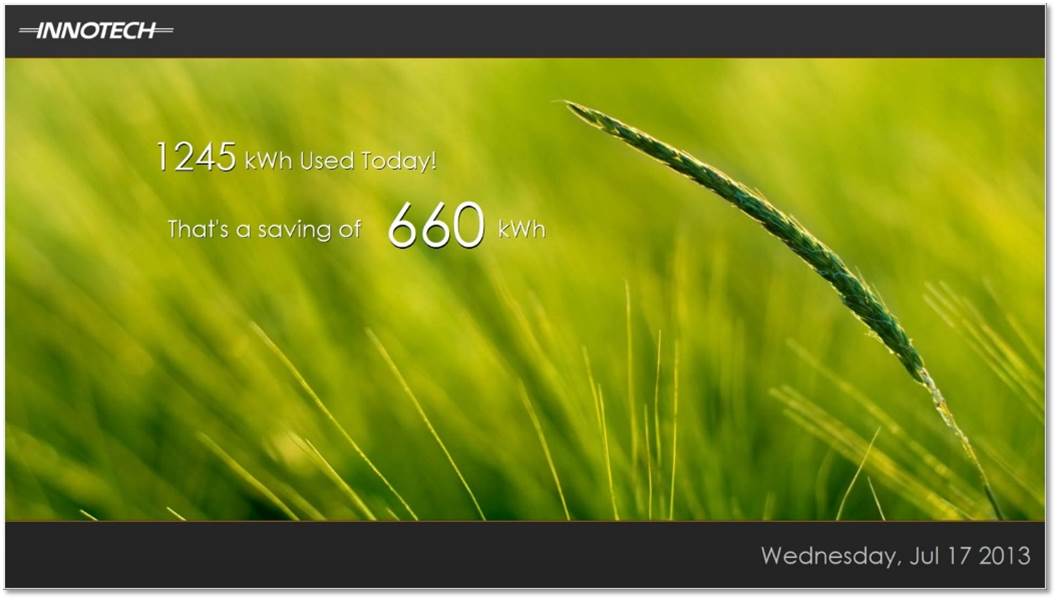
- View and identify inefficiencies in your system to reduce costs and
lessen your environmental impact
- People counting
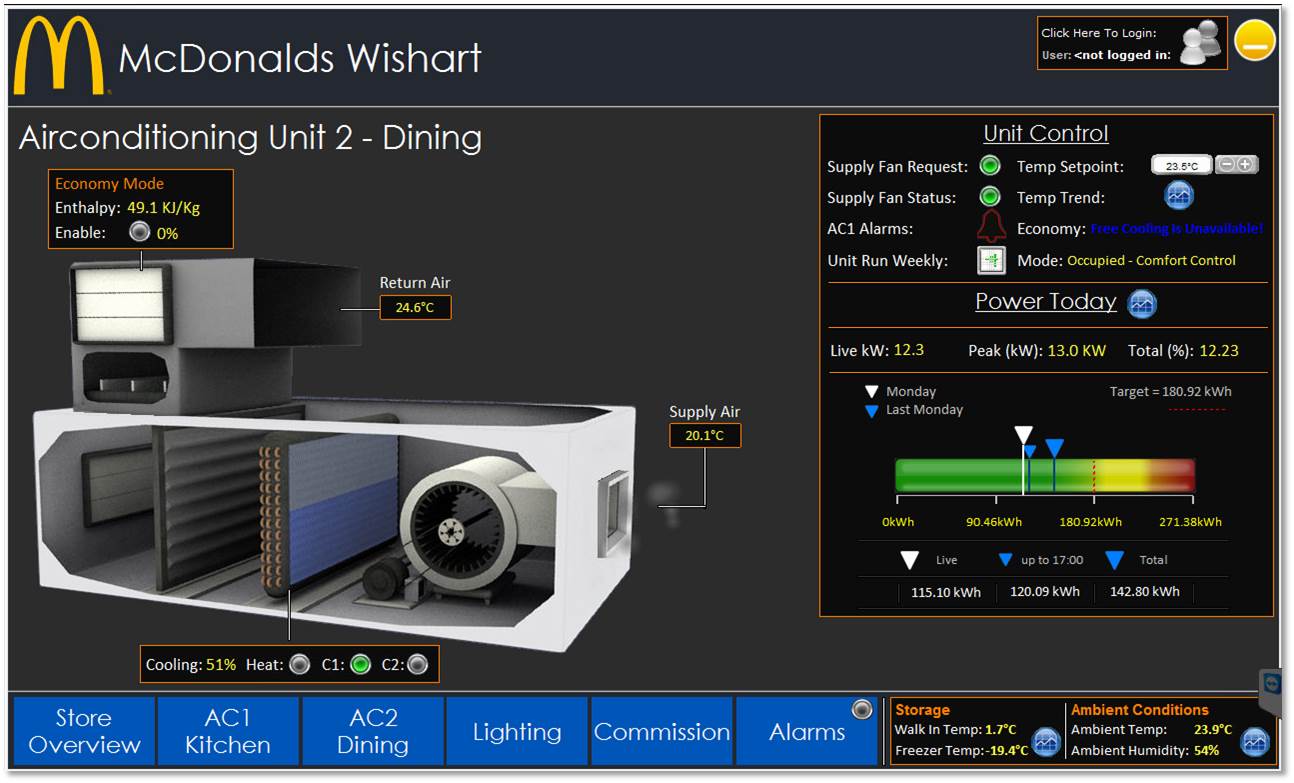
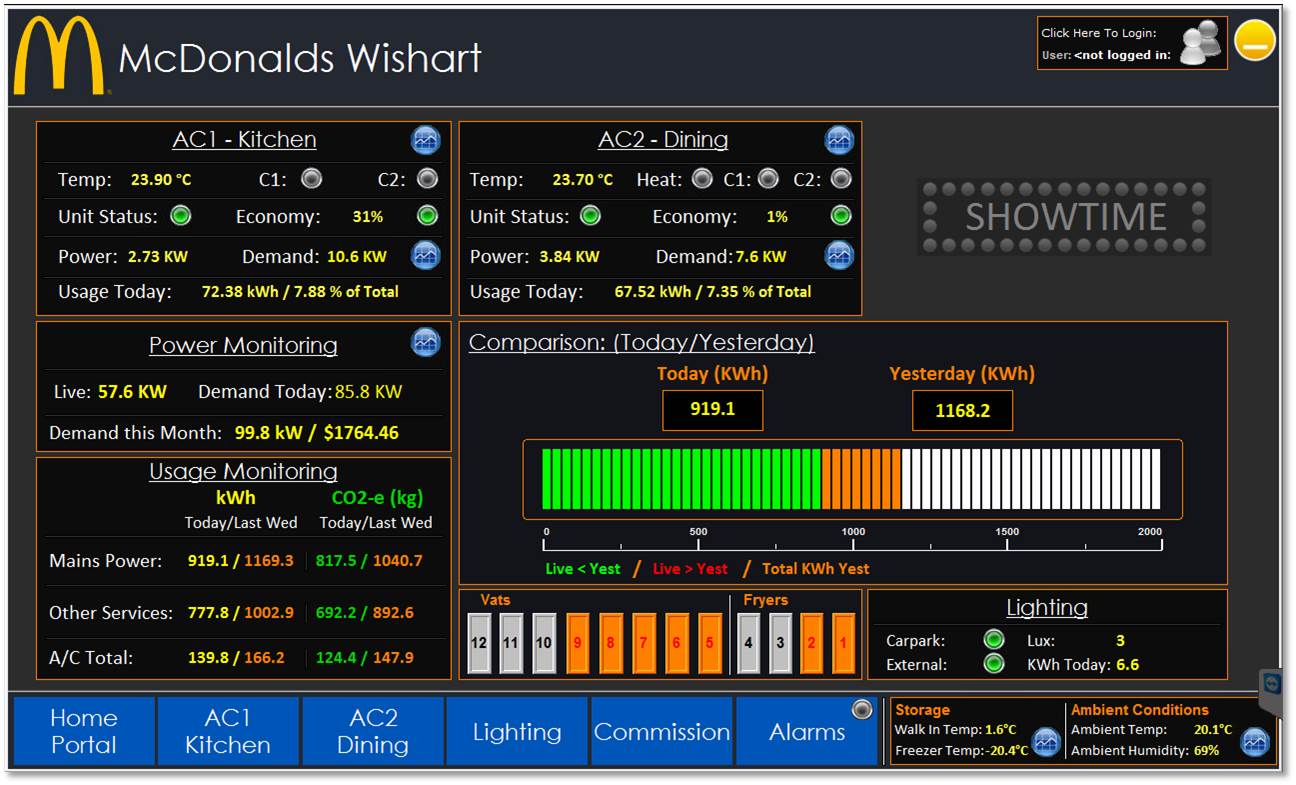
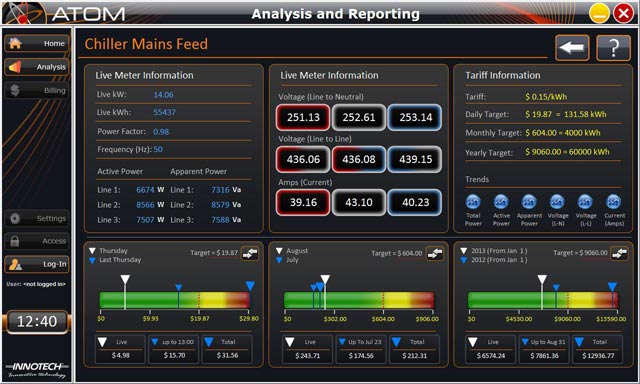
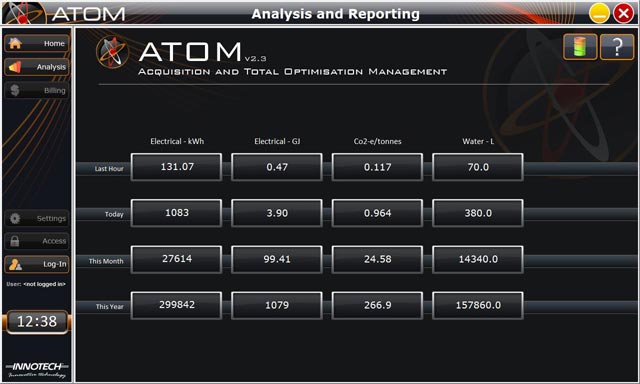
Real Time Monitoring
- View the entire system at a glance with live updating system
performance
- Monitor real time data via high level integration
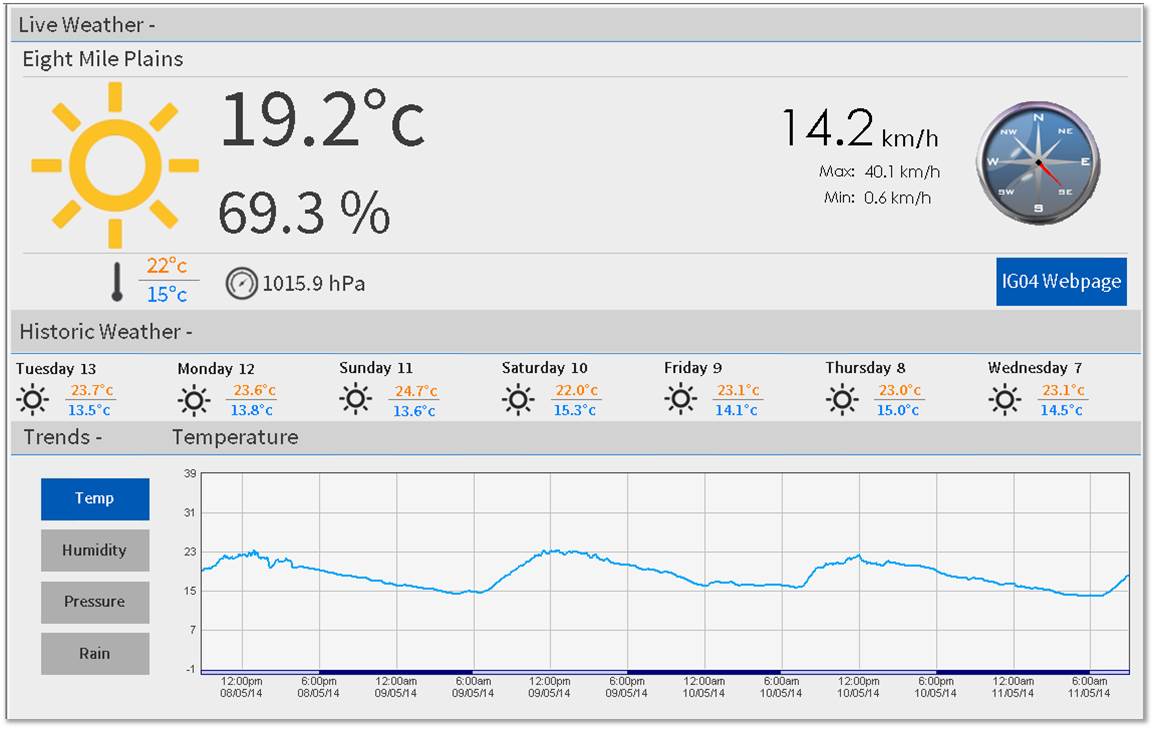
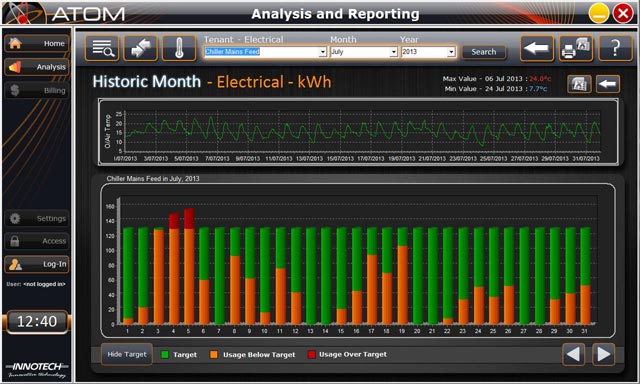
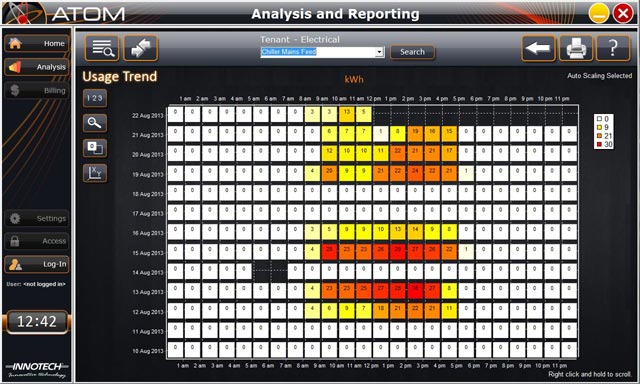
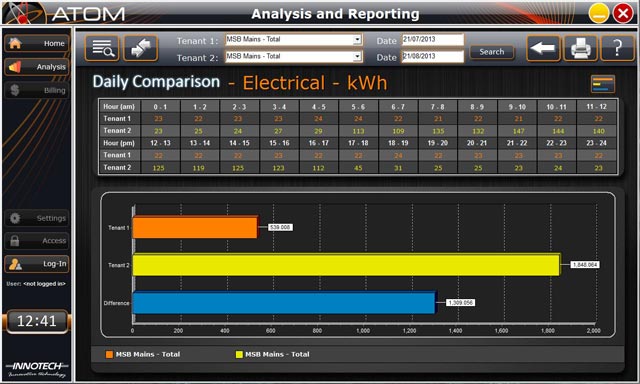
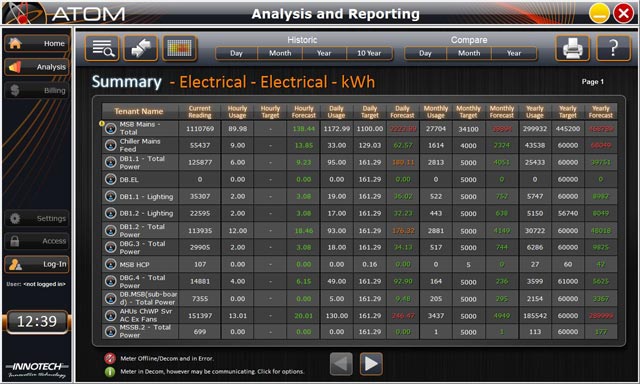
Data Analysis
- Review, analyse and compare historical data over any hour, day,
month, year or multiyear time frame
- Calculate forecasts for each Tenant/Service based on current
usage and historical performance data
- Coloured indication when forecasts exceed the set targets
- View individual Tenant/Service performance, set targets and
witness projections based on current and historical data